

Resource Limit is Reached
If you are seeing the following when visiting your website, it means that CloudLinux has stopped the processing of your website due to it reaching the set limit on your account. We use ‘CloudLinux’ system to ensure that no single hosting account can monopolize server resources to the detriment of any other. You can check your cPanel screen to see the memory, EP and CPU limits which should provide more details to what is being used up.
If your site is consistently hitting its resource limit is reached, you may wish to optimize the script you’re running on your account, or consider an upgrade.
To view resource limit information for your account, follow these steps:
Firstly, log in to cPanel.
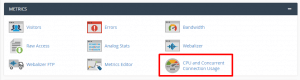
Secondly, in the METRICS section of the cPanel home screen, click CPU and Concurrent Connection Usage:
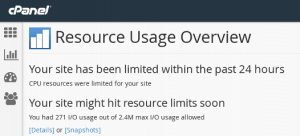
Thirdly, on the Resource Usage Overview page, cPanel displays a summary for your account. Depending on your account’s resource usage, you may see:
Next, Your site had no issues in the past 24 hours:
If you receive this message, your account did not trigger any limits within the past 24 hours.
Your site has been limited within the past 24 hours:
If you receive this message, your account triggered at least one resource limit within the past 24 hours. cPanel displays additional information about which resource (or resources) triggered the limit
Your site might hit resource limits soon:
- This message is a warning that your account may trigger resource limiting in the near future. cPanel displays additional information about which resource is at risk of triggering a limit.
And, to view detailed resource usage information for your account, click [Details]. cPanel displays usage graphs and a usage table:
- By default, cPanel displays resource usage information for the past 24 hours. To change the time interval displayed, in the Timeframe list box, select the interval you want, and then click Submit.
Next, to view resource usage snapshots, click [Snapshots]. Depending on your account’s resource usage, cPanel may display a list of processes and a list of database queries:
- In the calendar, select the date you want to view.
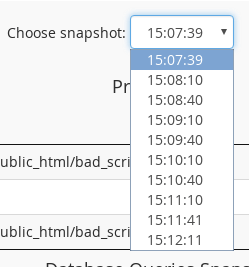
- In the Choose snapshot list box, you can select the snapshot for the specific time you want to view it:
- To move to the previous snapshot, click the Previous snapshot. To move to the next snapshot, click Next snapshot.
For your information;
Under the Process List, we see the following information:
- PID: This is the process ID.
- CMD: This is the actual command that the process ran.
- CPU: This is the CPU usage for the process. In this case, bad_script.php exceeded CPU capacity twice (102% and 101%).
- MEM: This is the amount of memory used by the process, in megabytes.
From this information, we can determine that the PHP script bad_script.php has some sort of problem that causes it to use a large amount of CPU capacity.