

Check memory usage on a Linux server
i) cPanel/WHM
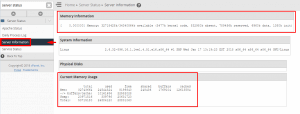
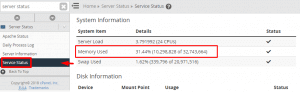
There are a few ways to check your memory usage of Linux Dedicated or Vitual Server in WHM or cPanel control panels. You may check the general overview of the server status via WHM > Server Information and WHM > Service Status, which also includes information about memory usage. For your reference:

ii) SSH Tools
There is a variety of different common SSH tools that can provide memory-related information. We will provide a few most common and useful tools, which would be present in pretty much any GNU/Linux system.
# free
This tool is one of the most basic, simple and fast ways to check overall memory usage via the command line. Its purpose is to show the amount of free memory available in the system: both physical and swap memory, and any buffers used by kernel. When you run this command, you will see something like this:

Here are the columns displayed:
Total: specifies the actual amount of physical RAM and swap available in the system
Used: shows how much is currently used by the system and its processes
Free: shows the amount of memory that is not occupied at the moment
Shared, buffers and cache: shows the amount of memory used by kernel for particular purposes, such as shared between different processes or allocated to cache.
There is one nuance you would want to take into account when analyzing the output of the free command. You might occasionally notice very small values for Mem line in the free column. Does it mean there is no free RAM in the system? In most cases, it actually does not since Linux-based systems often use cache for many processes to speed up and optimize programs performance. Only free memory is used for cache, and the system can always clear and replace content of the memory used for cache if there is such a need per requests of other running processes, so it does not actually have any negative impact on the performance.
So, the memory currently occupied by cache is technically not free, but practically can be freed at any moment. If you would like to check how much memory is actually available for processes in your system, take a look at -/+ buffers/cache line, free column. This field displays the amount of technically free memory plus currently cached and buffered memory, therefore, it is a more accurate representation of memory currently available for new processes if such a need arises.
Free command has a few parameters that may be useful. By default, the command displays the output shown in the screenshot. If you add -m or -g after the command, you will get the stats displayed in MB or GB correspondingly. In the modern versions of the free tool you can also use -h, and the tool will automatically use the most convenient units, like this:

# vmstat
This tool displays information about the current virtual memory usage: processes, memory, paging, disks and CPU statistics. When running this command, you will see three lines, first describing the particular sections of the table, second specifies the values displayed, third provides the actual stats at the moment of checking. If you need to check the usage from time to time, you can also add two numbers after the command to specify the delay in seconds between each check and the number of overall checks (if not specified, the checks are infinite until you end the process). Here is an example of the output:
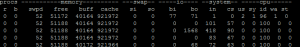
The first two lines provide the information on the organization of the table.
Procs shows information about processes: r means the number of processes running or waiting for run time, b means processes sleeping.
Memory section: swpd shows virtual memory used, free shows idle memory, buff and cache display memory allocated to buffers and cache correspondingly.
Two values in the swap section display amounts of data swapped to (si) and from (so) disk per second. Two values in the IO section show Input/Output stats for the drive: received from (bi) and sent to (bo) it.
In the system section in stands for interrupts per second, and cs is the abbreviation for context switches.
CPU shows percentages of processor usage:
us: usage by user-launched code as opposed to system processes
sy: usage by the actual system kernel
id: idle CPU time
wa: time spent waiting for Input/Output
st: time stolen from a virtual machine
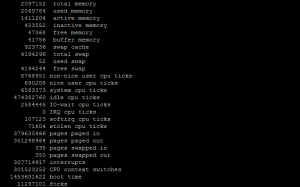
This tool also provides another way to structure this information. Feel free to use the -s parameter to display stats:
# ps
By default, this tool shows the processes currently launched and additional information on them. Here is an example of the output:
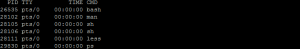
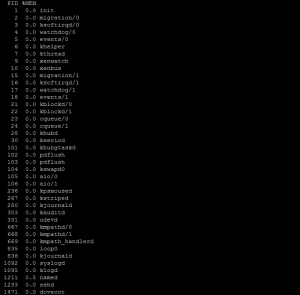
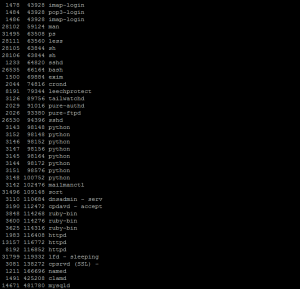
The output does not show any memory-related information, only the processes ran by the actual user starting the command. The real strength of this tool lies in its parameters. For instance, you can use -e to display processes of all users, -o to display data in a custom format and list a value like vsz in the formatting to display the size of virtual memory allocated for the process (expressed in kilobytes), or pmem to display percentage memory usage by a particular process. So, for ps -eo pid,pmem,comm= the output may be something like this:
Here are a few examples with combining ps tool and standard sort tool to display the output of the command in a more usable way:
ps -eo pid,pmem,comm= | sort -n -k 2

ps -eo pid,vsz,comm= | sort -n -k 2
This will display the processes run by users (which the current shell is allowed to check) in a user-defined format (process ID, memory usage, command name), and also sorted by the amount of memory used.
# top, htop
When you need to monitor resource usage of your system in real time, it is better to use tools that natively support constantly refreshing output of data, or even an interactive interface to modify the current workflow of the system. The output of the commands also includes information about memory usage and allows to sort through processes in different ways.
The output of memory-related sections of the tools is similar to the output of the free tool.
top
You can use h or ? to bring up the help menu and the q key to quit the program. PageUp and PageDownscroll through the output. The m key shows or hides memory-related information. Shift + M sorts the processes by memory usage.
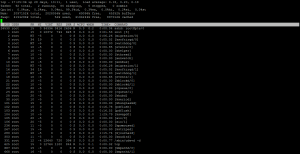
htop
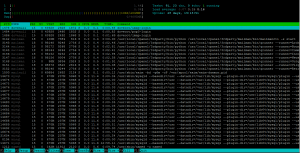
Once again, feel free to use h or ? to see the list of keys used by the tool, and Shift + M sorts the processes by memory usage, but you can also use F1-F10 menus you can see at the bottom to access different more visual ways of controlling processes in your system.
Check out next article on HOW TO: Change the language in your WHM.